
Many sales dashboards aspire to be the “cockpit for managing your business.” The control panel in an airplane cockpit contains a dizzying array of instruments — GPS navigation, engine status, fuel consumption, altitude, and more — for good reason.
Imagine you are tasked with flying a plane (through turbulent skies, no less) with instruments that only give you readings based on fuel consumption. You won’t run out of fuel, but you might fail to notice that you are getting dangerously low when flying over a mountain range.
If you only had altitude data, you might safely navigate over the mountains only to drop out of the sky when your tank suddenly goes empty.
All of those instruments in the cockpit allows the pilot to keep the plane in the air because it combines every necessary piece of information, across different sources, within a single view.
A good sales dashboard needs to do the same.
We recently added two powerful new instruments to the cockpits of Clari customers:
The Team Activity Widget: Understand Rep Activity and Prospect Engagement Within Target Accounts
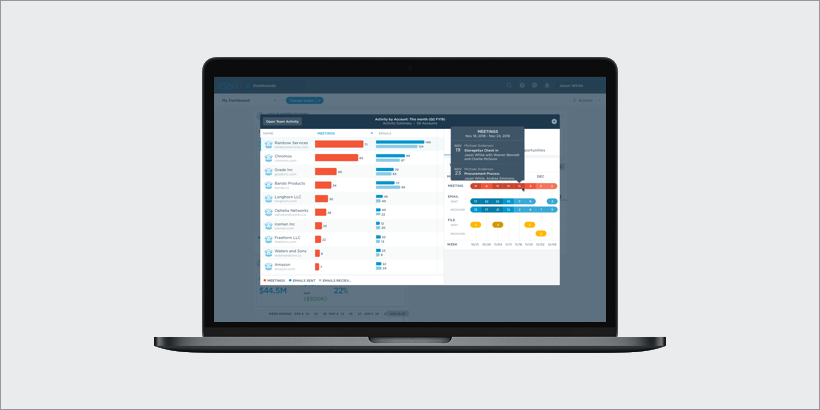
Our new Team Activity widget provides a summary of the top accounts by sales team engagement within a given time period, as well as leaderboards of rep activity within target accounts. This allows you to see how sales resources are being allocated across customer/prospect accounts, or which sales reps are driving the most engagement within their priority accounts.
In the above scenario, I can easily see we’re not deploying enough resources against our Amazon account, which is a critical renewal coming up next quarter. This is something we can catch early on and course-correct before it’s too late.
On the flip side, if Rainbow Services is a low-value account for us, there are better ways I can have my team spend their time.
The Pulse Widget: Combining Data Points, Reducing Blind Spots
The new Pulse widget provides a holistic picture of your business as it evolves across a variety of critical data points — open pipeline, won business, the sales team’s forecast and AI projections. This gives you the ability to triangulate where your quarter is likely to land, incorporating judgment from both human and machine.
I’m able to see my quota, what my team is calling, and what Clari’s AI is projecting. Based on this, I can easily call out several insights and take the corresponding actions:
- My team is calling $2.5m below our quota of $45m. It’s time to go into Clari and identify deals that can be pulled into this quarter to make up the difference.
- But there’s another concern: Clari’s AI is actually calling $41m, which is $1.5m lower than what my team is calling. What is Clari seeing that my team isn’t? I can go into Clari to pressure test those deals and identify risks the AI is picking up from historical data.
- Lastly, the purple line shows our pacing for the quarter, and it appears we’re right on track. This is a bright spot for us and means my reps may be able to hold value as we near the end of the quarter or even make more aggressive plays to shore up our gap to quota.
The Data that Matters
With the ability to bring data from Pulse and Team Activity into Clari Dashboards, Clari is the only turnkey product on the market that allows you to create a configurable and consolidated view of your business across all of the data sources that matter.
This is a big deal in a world where data silos are a common reality that create blindspots for B2B businesses leading to unmitigated risks and missed opportunities. Clari helps you avoid those blindspots by making it easier than ever to bring together the following sources of critical information about the state of your business:
- CRM Data: CRM data is still a foundational piece of any sales dashboard. It is critical for providing visibility into your pipeline and won/lost deals. But CRM data alone is not enough. Because CRM relies on manual data entry, it often paints an incomplete or inaccurate picture of deals.
- Sales Activity Data: Sales activity automation is the antidote to CRM’s reliance on manual data entry. By capturing every customer-facing interaction from email and calendar, you get visibility into what is actually happening in deals.
- Time Series Snapshot Data: Your business is not static. It’s constantly evolving, and having visibility into those changes as they happen is key. How has the pipeline evolved week-over-week? Which deals slipped out of the quarter in the last seven days? Clari’s Data Hub takes snapshots of all of your CRM data to provide insights that you just can’t get anywhere else.
- Forecast Data: The forecast is a critical signal of how the business is performing, because it represents human judgment on where you will land. Some aspects of reality are not well captured by CRM or activity data, so this is a key triangulation point.
- AI-Driven Predictions: As important as human judgment is, it is fallible. This is where AI has an important role to play in augmenting your sales team’s sense of which deals are on track or at risk, and where you are likely to land at the end of the quarter.
The cost of data silos and their resulting blindspots is highest during times of rapid change, whether that change is driven by unprecedented growth of your business or a pandemic-induced macroeconomic slowdown.
The Dashboard You Deserve
In times of change, it is as important as ever to ensure that all members of your organization have access to the information they need to make informed decisions on a daily basis. Successfully equipping your team to navigate uncertainty with data requires:
- A single pane of glass. As discussed above, you have to bring together all relevant data sources in one place. Especially in challenging times, you can’t expect people to hunt for information.
- Real-time insights. When things are changing quickly, offline exports, slides and spreadsheets lose relevance the moment they are created.
- Access for all. Once you’ve created the perfect “cockpit” for managing your revenue process, you need an easy way to deploy it to all members of your team to get everyone on the same page around a shared view of the business. A well-built dashboard doesn’t just aggregate data, it operationalizes a way of thinking.
To learn more about how revenue leaders are using Clari Dashboards to navigate change in their business, check out Clari from Home: De-Risking in the time of Coronavirus.