

Success metrics for marketing & top of funnel (TOF) leaders have evolved quite a bit over the years. The focus on quantity of leads created has been steadily replaced with more of an eye toward quality.
Lead scoring capabilities ushered in the era of Marketing Qualified Leads (MQLs) as a primary success metric, but that still left room for misalignment between marketing and sales teams. How many times have you heard marketers say they hit their MQL number only to have sales find them unusable?
Modern TOF leaders understand their role in the revenue operation — to create and accelerate high quality pipeline. Leads, meetings, and opportunities created are all potential leading indicators of future success, but Sales Qualified Pipeline should be the true goal.
What is Sales Qualified Pipeline?
Sales Qualified Pipeline are opportunities that sales has vetted and agreed to actually work. It’s the metric that all TOF programs should be optimized around because those are the deals that could actually end up as revenue. It aligns everyone across sales & marketing, and ensures that everyone is speaking the same language.
The challenge that many TOF leaders face is that their tools are not optimized for pipeline reporting. They may not have the right permissions in CRM or BI systems to cobble together sales reports, so instead are beholden to finance, sales ops, or biz ops teams for reporting. This is suboptimal for a number of reasons. TOF leaders deserve the tools and autonomy to perform their own analyses to track their goals and deepen their understanding of pipeline health — and the programs that contribute to these efforts.
Analyzing Sales Qualified Pipeline in Clari
In this series of blog posts, we will explore different categories of TOF analysis and discuss how TOF leaders can work with their cross-functional peers to drive action and maximize revenue.
Clari allows us to have as much rigor at the top of the funnel as exists at the bottom of the funnel, and to optimize every component of our revenue operation.
Here are a few questions I ask & answer using Clari, and the actions that result:
How are we pacing toward pipeline created goals?

Weekly pacing charts are exceptionally useful to track progress toward our TOF goals and to inform my understanding of various growth campaigns & tactics.
At Clari, we track:
- Stage 0 pipeline: a meeting has been set by our revenue development team, and
- Stage 1 pipeline: our AE has taken the meeting and validated the opportunity (sales qualified pipeline).
I’m able to easily see how these 2 sales metrics are trending over time, which is critical because they tell us how much interest in Clari there is in the market — and more importantly — how much of that interest could actually end up as revenue.
Every Friday, I send an update to our Executive Team that combines the quantitative analysis from Clari with my own qualitative insights about why things are happening and which programs are responsible for results.
Here’s an excerpt from a recent report:
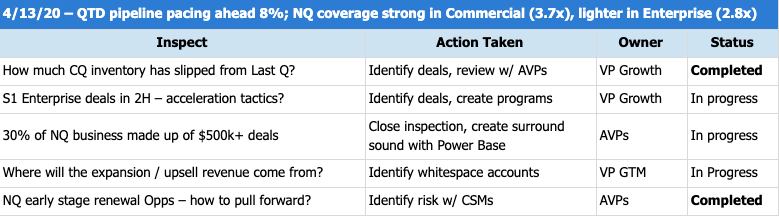
These insights allow me to spot issues proactively, knowing in real-time when we’re off-pace. I can then work with sales leadership to spot check their pipeline inventory and ensure various processes and SLAs are being adhered to.
Are handoffs happening across the right teams and at the right times? Are the right actions being taken by the right team members to move opportunities through our sales process at the right velocity?
This kind of rigor ensures standardized definitions for sales stages across our revenue org, and gives us confidence that the early stage pipeline is viable and being worked by sellers.

From there, I can work with the biz ops & finance teams that modeled the business to create our S0 and S1 targets, and keep them informed on how their assumptions are bearing out. On the luckiest of occasions, I even get more budget from these conversations to double down on successful programs.
The main upshot is that we can track the key leading indicator of future success for the revenue team in real-time, make course-corrections as necessary, and do everything in our power to support the revenue targets.
How are we tracking toward regional / segment pipeline goals?

This regional breakdown is a continuation of what I outlined above, but is more tactically useful to inform my conversations with regional AVPs of sales. It also allows me to allocate budget with more precision as the quarter shapes up.
In the example above, you can see that the West team has a similar amount of Stage 0 Pipeline (SDR qualified), but is pretty far behind on Stage 1 Pipeline (Sales qualified).
I can work with the AVP of the West team to understand what’s preventing these opportunities from moving through the funnel.
- Are the opps low quality?
- Are reps not adhering to process?
- Is additional support needed from the growth team by way of ABM campaigns?
Once I get answers to those questions, I can investigate how to redirect marketing budget to supplement the regions & accounts that need it. I can work with the enablement team and individual SDRs & sales reps to ensure that their processes are well enough defined and indoctrinated.
This same kind of analysis holds for sales segments, like SMB, mid-market, and enterprise. I can easily split into a segment-based view instead of (or in addition to) the regional view above and explore the same sorts of questions.
I have a constant pulse on deal velocity, and know how well the new pipeline is moving through the funnel. I can easily see how different regions and segments are performing, and use these insights to help inform modeling assumptions on the biz ops side. Finally, I can ensure common stage definitions across people & teams, and have full confidence in pipeline categories.
When is the pipeline we’re creating today set to close?

How real is the pipeline that’s being created?
This can be a notoriously difficult question to answer at the top of the funnel. The view above is a deceptively simple way to assess your pipeline inventory. You should have a sense of your sales cycle duration by segment, and can use this view in Clari as a health check for newly created pipeline.
The view above shows Q1 pipeline created QTD broken down by segment and expected close dates. The light blue bar is our SMB segment, which typically has an average deal cycle of about 60 days. Knowing this, it’s concerning that so much of the pipeline we’ve created in Q1 isn’t set to close until Q4.
Now in my next conversation with our SMB sales leader, I can inspect those deals to understand why so much is landing in Q4 and can close out any pipeline that does not satisfy qualification criteria.
Once we know how real the pipeline we’ve created actually is, we can discuss what we may be able to pull forward into Q2 or Q3.
- Which deals would benefit the most from deal acceleration tactics?
- How can we leverage other TOF resources like the revenue development team and feld marketing?
- Which ABM tactics may be helpful to create more surround sound within the account?
All of these lovely tactics stem from this simple view.
----
This type of analysis is the foundation for top of funnel rigor. Once this foundation is in place, you can build off this analysis to ask even more pointed questions, understand your pipeline even more deeply and have confidence in your predictions for what’s going to happen in the future.
In the next blog, I’ll cover how to think about & assess the quality of the pipeline you’re creating.
Until then, here is some related reading you might enjoy:
- 5 Questions You Should Ask About Your Pipeline Right Now
- Everything You Need to Know About Your Pipeline Coverage
- Become a Master of Your Pipeline