

As the old adage goes: You can't manage what you don't measure. In sales, accurate measurements could mean the difference between hitting your number or coming up short. This is where sales performance metrics and KPIs come in. Without them, you'll be left in the dark when it comes to leading your revenue team to success.
Thanks to powerful AI-based solutions, we now have more sales data than ever at our fingertips—but just having access to sales metrics isn't enough. In order to run revenue effectively, it's essential to know what to measure and how to interpret the results.
Here's how to ensure your business selects the right sales KPIs, tracks those metrics consistently, and works to improve sales performance and achieve revenue precision.”
Table of Content:
- What are sales performance metrics?
- How can tracking sales metrics improve sales performance?
- What are the most important sales performance metrics?
- Productivity metrics
- Efficiency metrics
- Quality metrics
- How to choose the right sales metrics for your team
What are sales performance metrics?
Sales performance metrics are key indicators sales reps and managers can use to measure and improve sales performance.
A sales performance metric is not the same as a sales metric. The latter is raw data (like the number of dials a rep makes). The former offers deep insight into the sales process.
You’ll want to track various sales performance metrics for a complete view of your sales process. As you’ll see below, you can break down performance KPIs into several categories to understand your team's effectiveness, the efficiency of your pipeline, and the quality of deals you close.
How can tracking sales metrics improve sales performance?
Tracking sales performance metrics can improve your team’s sales performance in several ways:
- Identify opportunities to improve sales performance: Focusing on the data makes sales reps accountable and provides managers with prime coaching opportunities based on metrics, grounding conversations in data instead of opinion.
- Create better compensation plans: Compensation plans are an effective motivation tool for sales reps. You can use sales performance metrics to make yours as appealing and achievable as possible (while still being profitable for your business). You can also use these metrics to tailor compensation plans to individual sales reps.
- Find more profitable markets: Tracking the size and quality of each deal in your pipeline will help you uncover profitable markets you can capitalize on. It will also show you which markets sales reps should avoid.
- Find ways to improve your sales process: By offering insight and visibility into the sales process, sales analytics offers revenue leaders actionable insights into more significant sales trends happening in sales cycles. Are deals taking longer to close? Are average contract values sinking? If so, how can you steer the team back on course?
What are the most important sales performance metrics?
Identifying the important metrics for your business and your team depends on key performance indicators that you identify as vital to your business model, such as selling motions, sales processes, sales cycles, and more. One way to identify your sales KPIs is to align them with your strategic growth initiatives.
Here are a few examples:
Going up market: If you're aiming for the enterprise sphere, you'll want to see your average deal size and average revenue per unit increase. This signifies larger deals from larger customers.
Rep attainment: If the goal is for all reps to meet quota, you may want to focus on activity metrics and performance indicators, such as emails sent, phone calls made, and meetings booked.
Scaling commercial or SMB markets: If your goal is to scale your commercial business, you may want to examine how to decrease the sales cycle length for this higher velocity portion of the business while increasing average revenue per unit.
These are just a few ways to tie your sales metrics and sales analytics back to strategic revenue goals. The metrics you track are a means to that end goal, not the end itself.
Here are 17 of the most critical sales metrics we recommend tracking for any revenue team:
Productivity metrics:
- Annual Recurring Revenue
- Average Revenue Per User
- Quota Attainment
- Average Profit Margin
Efficiency metrics:
- Sales Cycle Length
- Deal Slippage
- Sales Linearity
- Lead Response Time
Quality metrics:
- Win Rate
- Conversion Rate
- CRM Score
- Churn Rate
- Net Retention Percentage
Quantity metrics:
- Average Deal Size
- Pipeline Coverage
- Number of Deals Closed
- Sales Activity Metrics
Productivity metrics
Sales productivity metrics measure the value of your sales efforts and how much money you’re generating in return. The better your productivity metrics, the more revenue you should generate.
Annual recurring revenue / Monthly recurring revenue
Annual recurring revenue, or ARR, is the total amount of contracted revenue that your company brings in each year. It's a particularly crucial key performance indicator (KPI) to follow for any SaaS business that is subscription-based, as it tells you how much money you can expect to receive from customers in a given fiscal year. When tracked historically, ARR can be used to evaluate a company's growth and assist in long-term forecasting.
The ARR calculation:
Annual recurring revenue (ARR) = (total value of a contract) / (number of contract years)
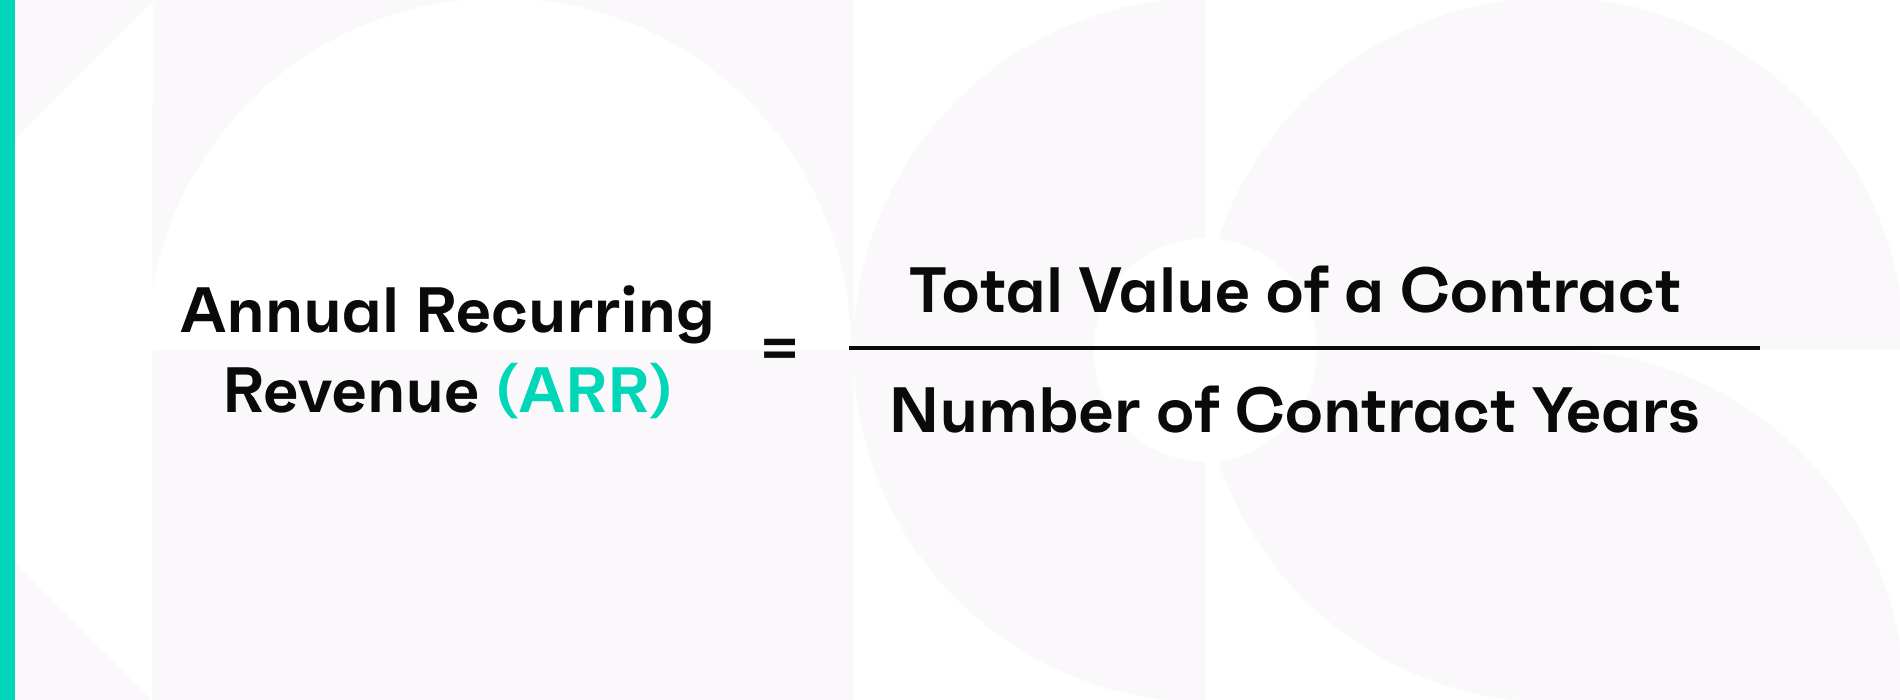
For a 2-year annual contract totaling $50,000, the calculation would be $50,000/2 = $25,000. Add up the ARRs for each contract to calculate the total ARR. You can also look at ARR by product or region to gain insight into the performance of specific solutions or areas.
The same applies to monthly recurring revenue (MRR), which represents the total amount of contracted revenue your sales team expects to bring in each month.
For a license-based approach, there is an alternative formula that can be used if the contract includes variable revenue per year. For example, when growth is baked into the terms, a $60,000 contract over three years could be $10,000 in year one, $20,000 in year two, and $30,000 in year three.
The variable revenue ARR calculation:
Variable Revenue ARR = Number of Active Licenses that Year x Average Revenue Per User (ARPU)
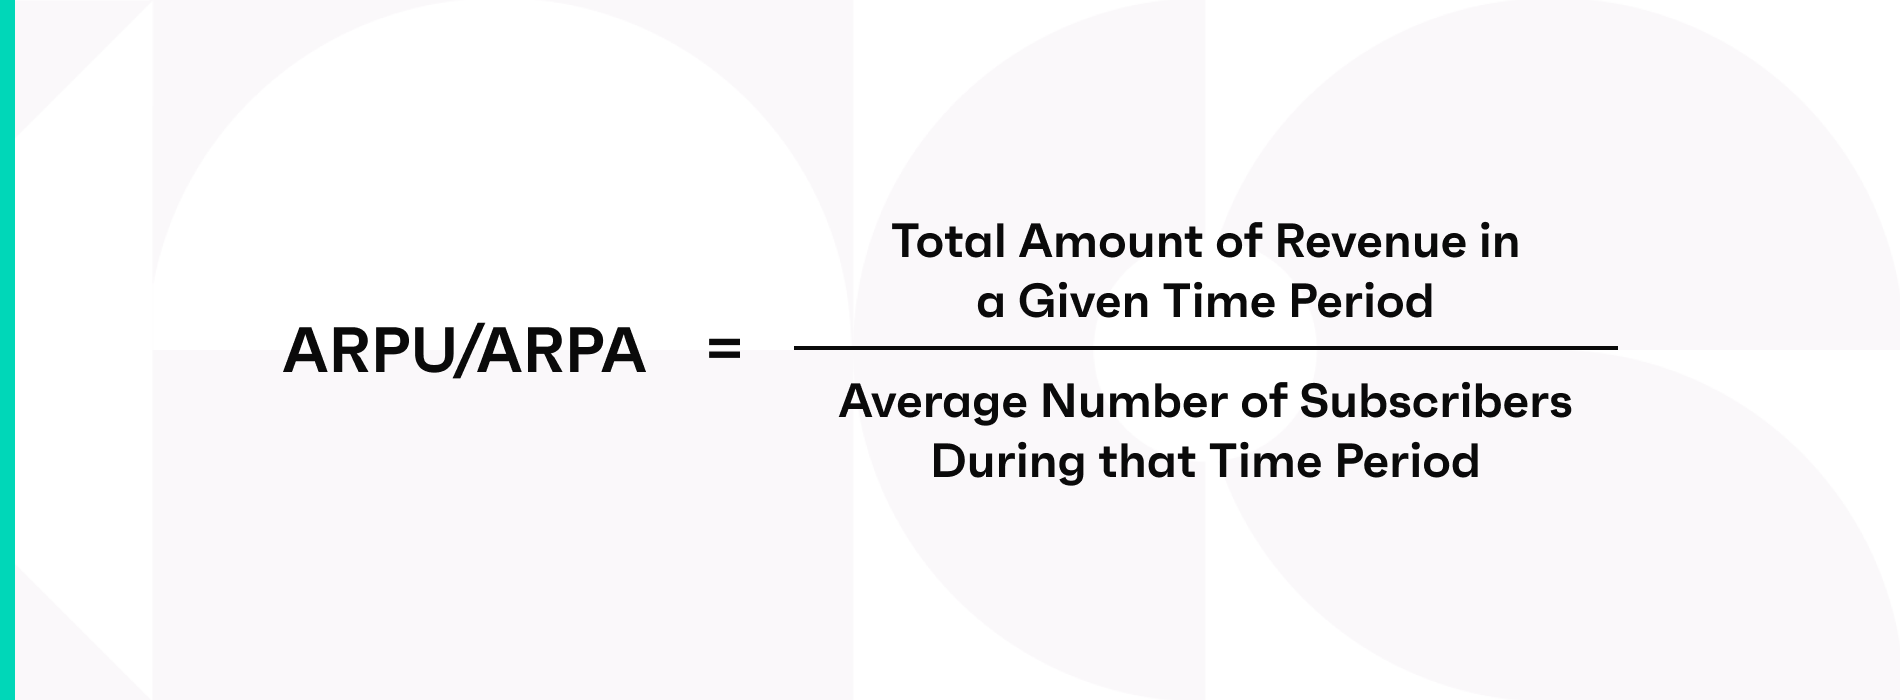
Average revenue per user / Average revenue per account
Average revenue per user (ARPU) or average revenue per account (ARPA) refers to the amount of money that a company brings in per subscriber, user, or account in a particular time period. It is calculated by dividing the total amount of revenue for that time period by the number of subscribers, customers, or accounts during that period:
The ARPU/ARPA calculation:
ARPU/ARPA = (total amount of revenue in a given time period) / (average number of subscribers during that time period)
This KPI is helpful to track for a few reasons. If your ARPU is increasing, it's an indicator that your revenue is holding value. You may be able to avoid steep discounts just to get customers on contract or avoid scrambling to hit your number at the end of the quarter.
Identifying your highest ARPU customers may also give you an idea of your best product-market fit. For example, if you notice that cybersecurity and telecommunications firms are your highest ARPU clients, that may be a signal to double-down in those segments because you know they're willing to pay the asking price for the value that your product brings them.
Quota attainment
Quota attainment is exactly what it sounds like: the percentage of deals (either by number or by revenue) a sales rep has closed in relation to their set quota for a given time period. It can be measured per month, quarter or year, depending on your sales cycle.
The quota attainment calculation:
Quota attainment = (number of closed deals or revenue in a given time period) / (quota for that time period)

This is an important sales forecasting metric to monitor in order to keep track of how deals have closed against targets as well as to identify reps who might benefit from more coaching or guidance. Tracked over time, reps' quota attainment percentages might even signal the need for team structure changes.
This number isn't static throughout the month or quarter, so you should measure it at a consistent cadence during your 1:1 meetings between a rep and sales manager. This will also allow you to track whether your team is moving deals through the sales pipeline consistently throughout the current quarter and next quarter.
Average profit margin
Average profit margin measures, in essence, the pulse of your business. This KPI ultimately tells you how your company is doing.
Average profit margin is calculated by dividing your company's net income by its net sales.
The average profit margin calculation:
Average profit margin = net income / net sales
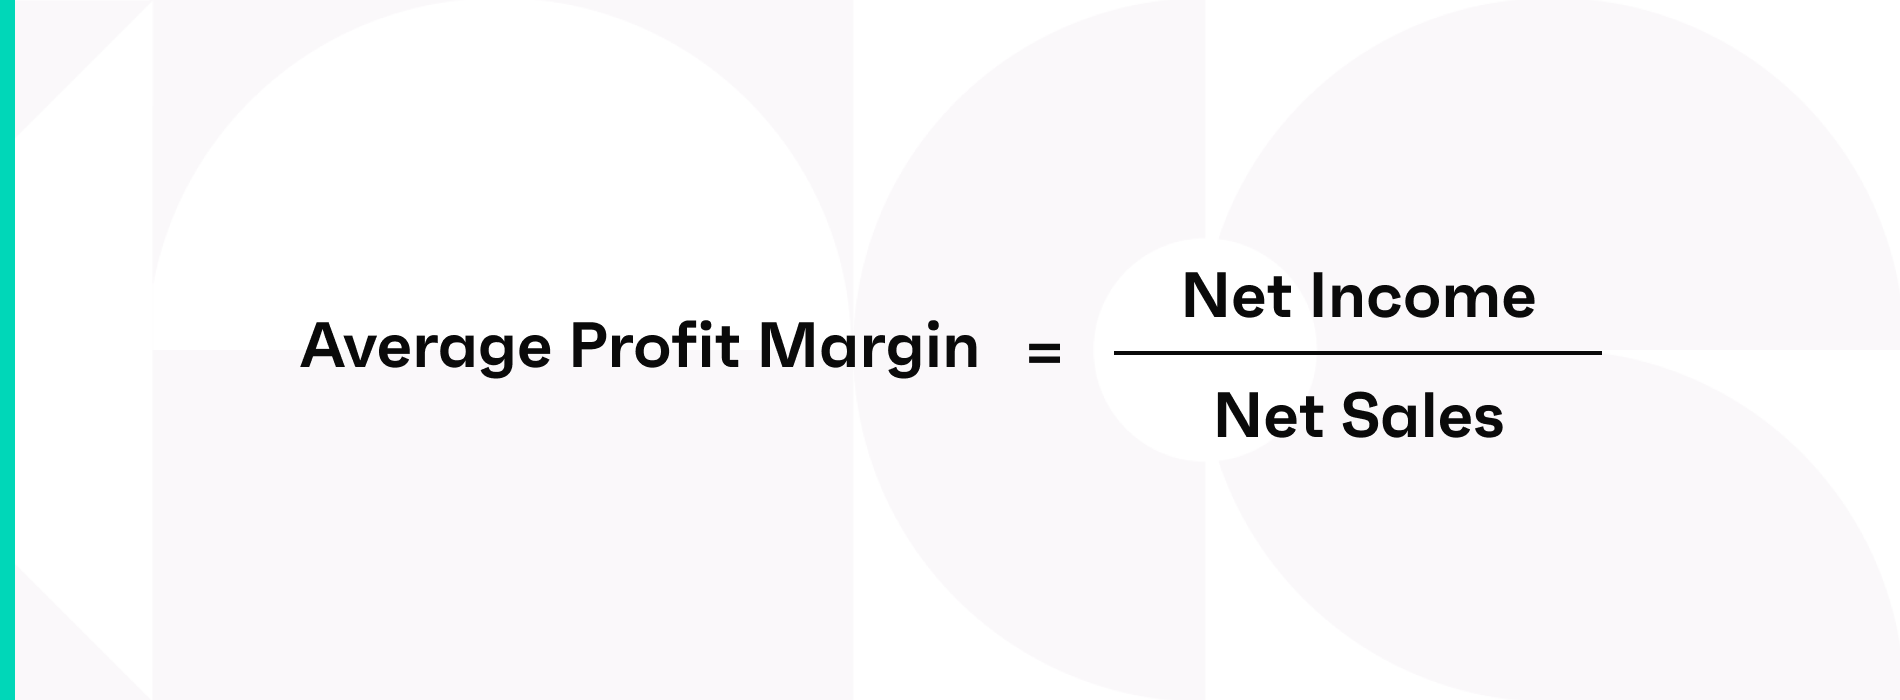
To find your net income, subtract your company's total expenses from the total revenue. Net sales is calculated by subtracting the total returns or refunds from total sales.
Average profit margin can also be measured by product, region, and rep to gain insight into how each segment of the business is performing.
Efficiency metrics
Sales efficiency metrics measure the performance of your sales pipeline. Are you getting deals through quickly, and is your pipeline predictable?
Sales cycle length / Time in each stage
Sales cycle length refers to the average amount of time it takes for a new customer to move from the opportunity stage to a closed deal. Understanding this metric can help sales teams determine whether there are any bottlenecks in their sales process—which can not only delay deals but potentially lose them—and streamline the sales process moving forward for a better close rate and more accurate forecasts.
Sales organizations should also track the amount of time that deals stay in each stage within the sales process. This will help them spot at-risk deals so they can determine whether the sales opportunities are stale and in need of purging or whether there are actions they can take to push them forward.
Deal slippage
Deal slippage refers to the number of deals in the commit stage that fail to close within the forecasted range. If a deal is in commit for Q1, for example, but gets pushed to Q2 due to the project being stalled or budget freezes, that is considered a slip.
The misconception here is that any slippage is bad. The reality is that every company experiences deal slippage. The important thing is to know what your average slip rate is so you can prepare for it.
It's possible to manually track slipped deals in spreadsheets or CRM, but new sales technology like Clari allow revenue leaders to not only identify how many deals slipped and how much revenue they represent in real-time with just a few clicks of the mouse, but also which deals slipped and what you can do about it.
Sales linearity
Sales linearity is the steady and predictable pattern in which deals close throughout the quarter. The idea is that sales linearity helps avoid the end of quarter scramble to get deals in and make quota.
Ideally reps attain 20% of quota by the end of the first month of the quarter, 50% by month two, and 100% by the end of the quarter.
Best-in-class revenue teams strive to achieve this aspirational target for a number of reasons:
Relief from heavy discounting at the end of the quarter just to make their number
More predictable revenue, allowing more strategic and sound investments
Better cash flow
Customer success teams can plan onboarding resources to support new customers”
Lead response time
Lead response time is the average time a sales rep takes to respond to a new lead. It’s typically measured in minutes and tells how fast your reps respond to each new lead.
Here’s how you measure it:
Lead Response Time = Time taken to respond to all leads / No. of leads
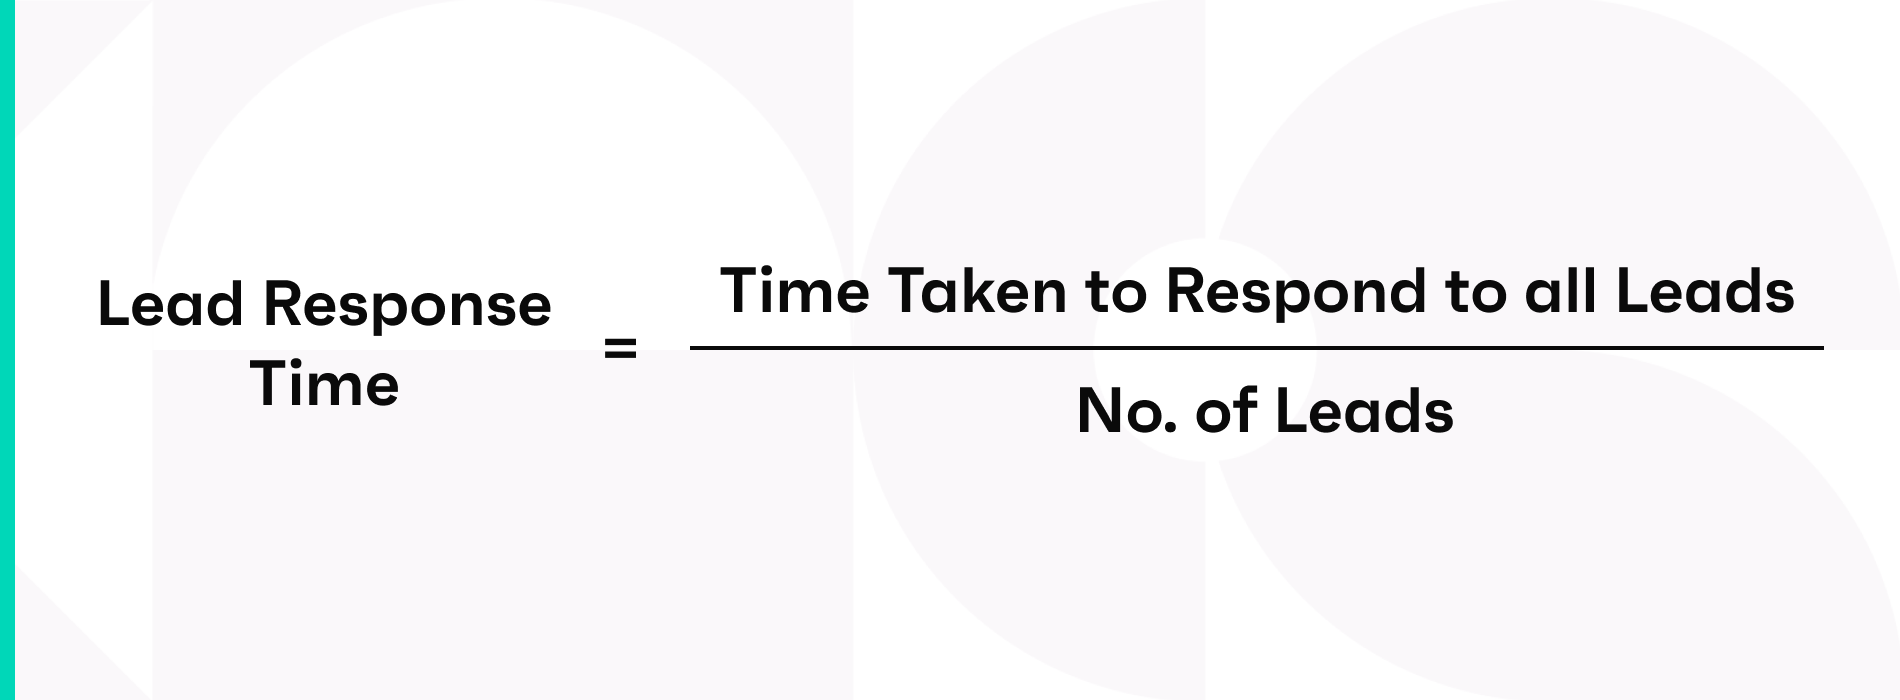
Tracking this metric is vital to convert as many new businesses as possible. Speed matters, after all, and the quicker your reps respond to a lead, the more likely that lead will convert.
By tracking this response time, you’ll see the urgency with which reps treat new leads. It will also help you develop a benchmark by which you can measure future rep performance.
Quality metrics
Sales quality metrics are a measure of your team’s effectiveness. How often are reps getting deals across the line, and how good are those deals?
Win rate
Win rate refers to the percentage of deals that are closed-won within a specific time period.
The win rate calculation:
Win rate = total # of won opportunities / total # of closed opportunities (both won and lost)
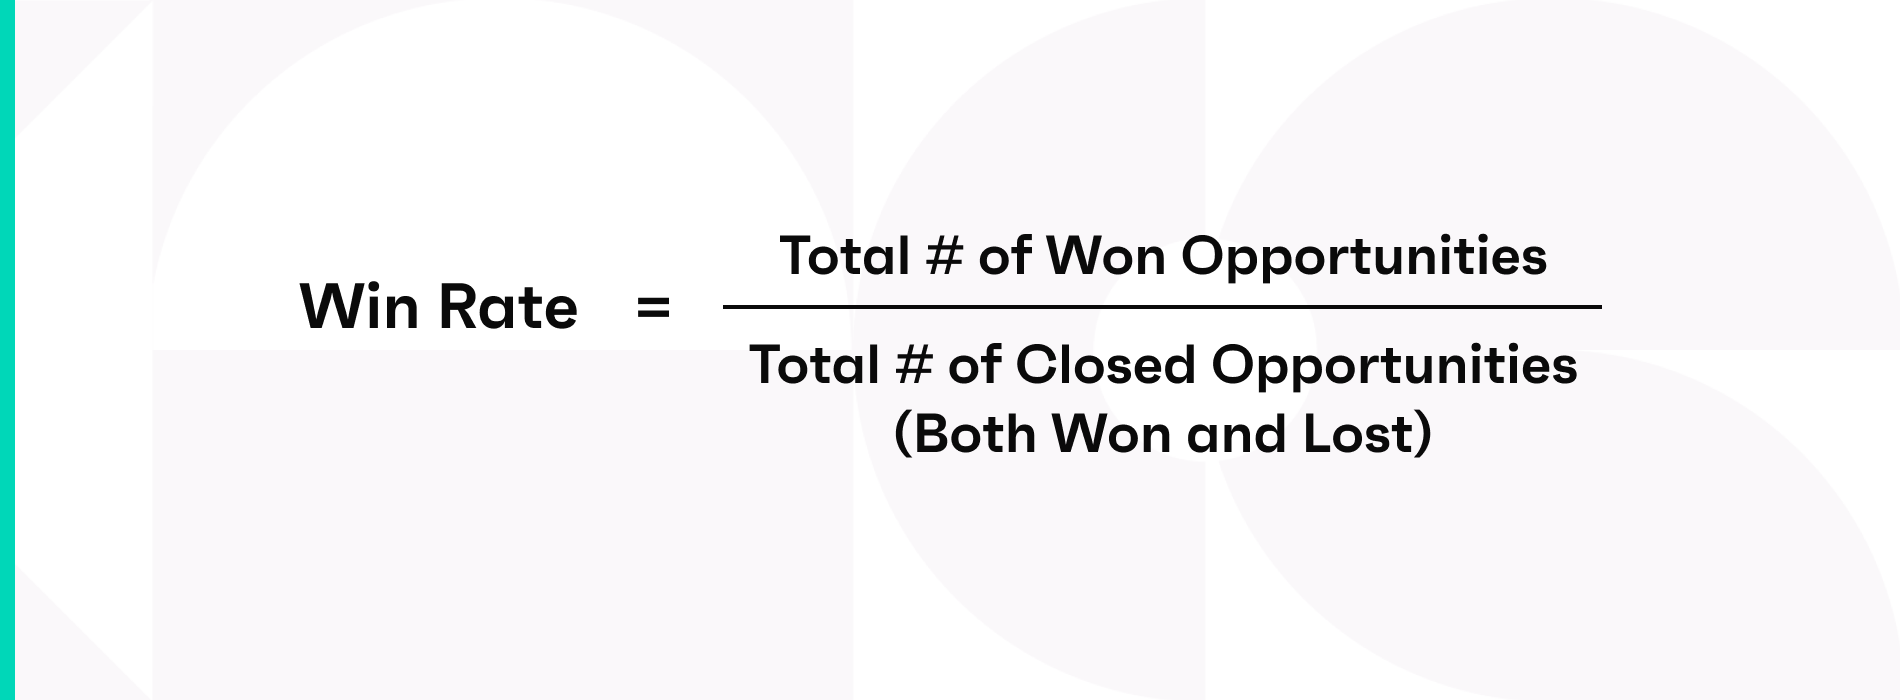
Analyzing how the win rate changes over time can help you gauge your sales reps' performance as well as how much sales pipeline coverage you need to hit your sales targets. Segmenting win rates by product, team, marketing campaign, or other factors can offer insight into each factor's variations in performance.
Conversion rate
In sales, the conversion rate refers to the number of qualified leads that result in closed-won deals.
The conversion rate calculation:
Conversion rate percentage = (# of leads converted into sales / total qualified leads)
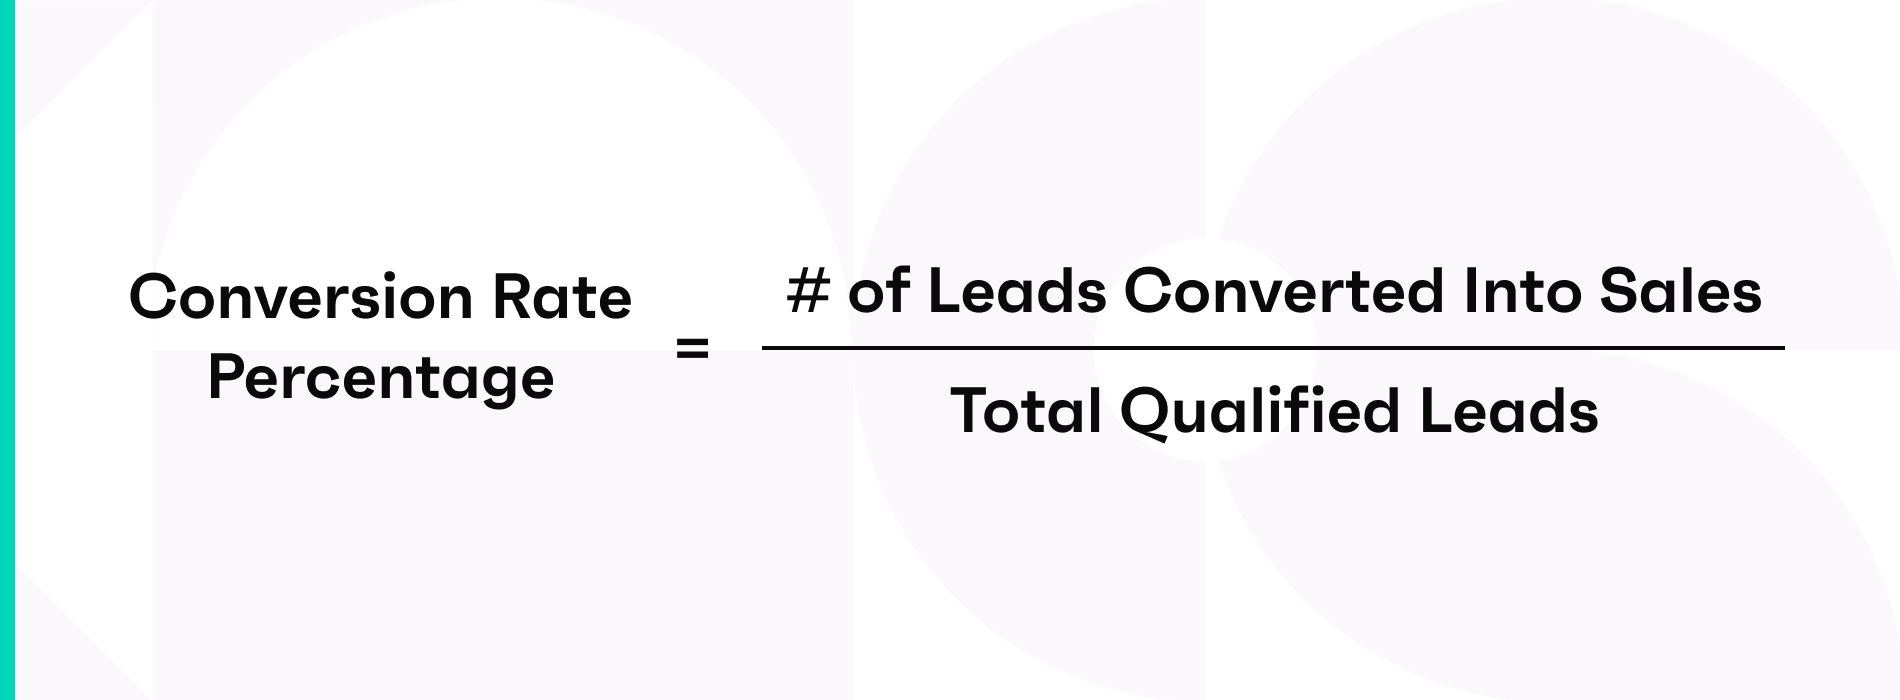
When tracked over time, this key metric can measure how well your sales team turns leads into new customers and it can improve the overall quality of leads by aligning the sales and marketing teams. Monitoring conversion rates over time and the characteristics of those leads ensures that your company focuses on selling to relevant buyers and continues to grow.
For businesses with longer sales cycles and multiple sales stages, it's beneficial to track the conversion rate between each stage. For example, how often do net new leads turn into sales qualified pipeline and how often does sales qualified pipeline turn into revenue?
Understanding these conversion metrics at every stage will help you continue to tighten your revenue machinery. If the historical conversion rate from net new leads to sales qualified pipeline is very low, you may need to consider fine-tuning your top-of-funnel messaging or instrumentation to bring in a different cohort of leads with more specific qualifications.
Another twist to this is analyzing conversion rates by lead source. To get a sense of which sources tend to convert to new customers, which get stuck, and which are lost, sales teams should track the origin of deals in the sales funnel.
CRM score
Clari's CRM Score is an artificial intelligence-driven numeric value based on an analysis of historical data from opportunities, such as how long a deal has stayed in a given sales stage, whether the close date has been pulled in or pushed out, and whether the deal size has increased or decreased.
The CRM Score is one of many predictive analytics sales analytics tools that can help revenue teams identify the likelihood that a deal will close based on previous deals with similar behaviors and can help leaders identify if a deal is at risk and where reps should spend their time.
A deal with a high CRM Score may require less attention than a deal with a low CRM Score. It's a critical input for pipeline management. Here's how it works as part of a 4-point deal inspection.
Churn rate
Churn rate refers to the number of your customers who either cancel or don't renew their subscriptions during a specific time period.
The churn rate calculation:
Churn rate = number of churned customers / total number of customers
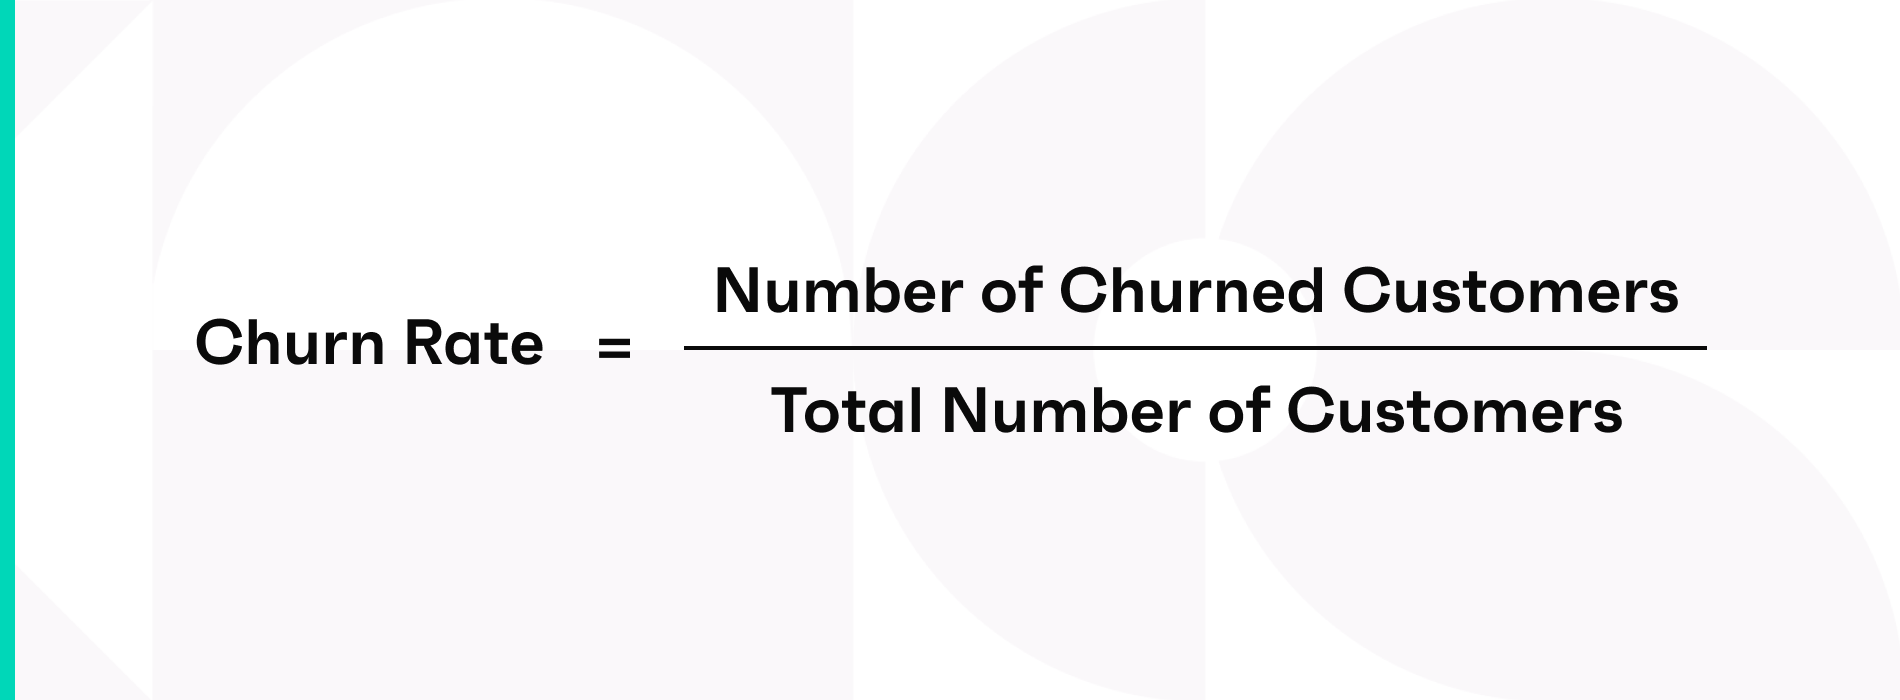
Customer churn is a critical metric to track for any business with a subscription model. If you're losing customers as fast as you're gaining them, your net growth remains at zero. This is the core reason why protecting your customer base, providing fantastic customer experience, and continuing to innovate in order to provide value is so important.
Identifying accounts at risk of churning can be tricky and often require complex spreadsheets, but new sales technologies can provide revenue teams with more visibility into renewals at risk so they can take a proactive approach to preventing churn.
Net retention percentage
Given the continued market uncertainty these days, more and more businesses want to keep their current customer bases in an effort to maintain a level of stability. Net retention percentage goes hand-in-hand with churn rate but with a slight twist.
The net retention percentage calculation:
Net retention percentage = (Renewal ARR + Upsell ARR - Churn) / (Target Renewal ARR)
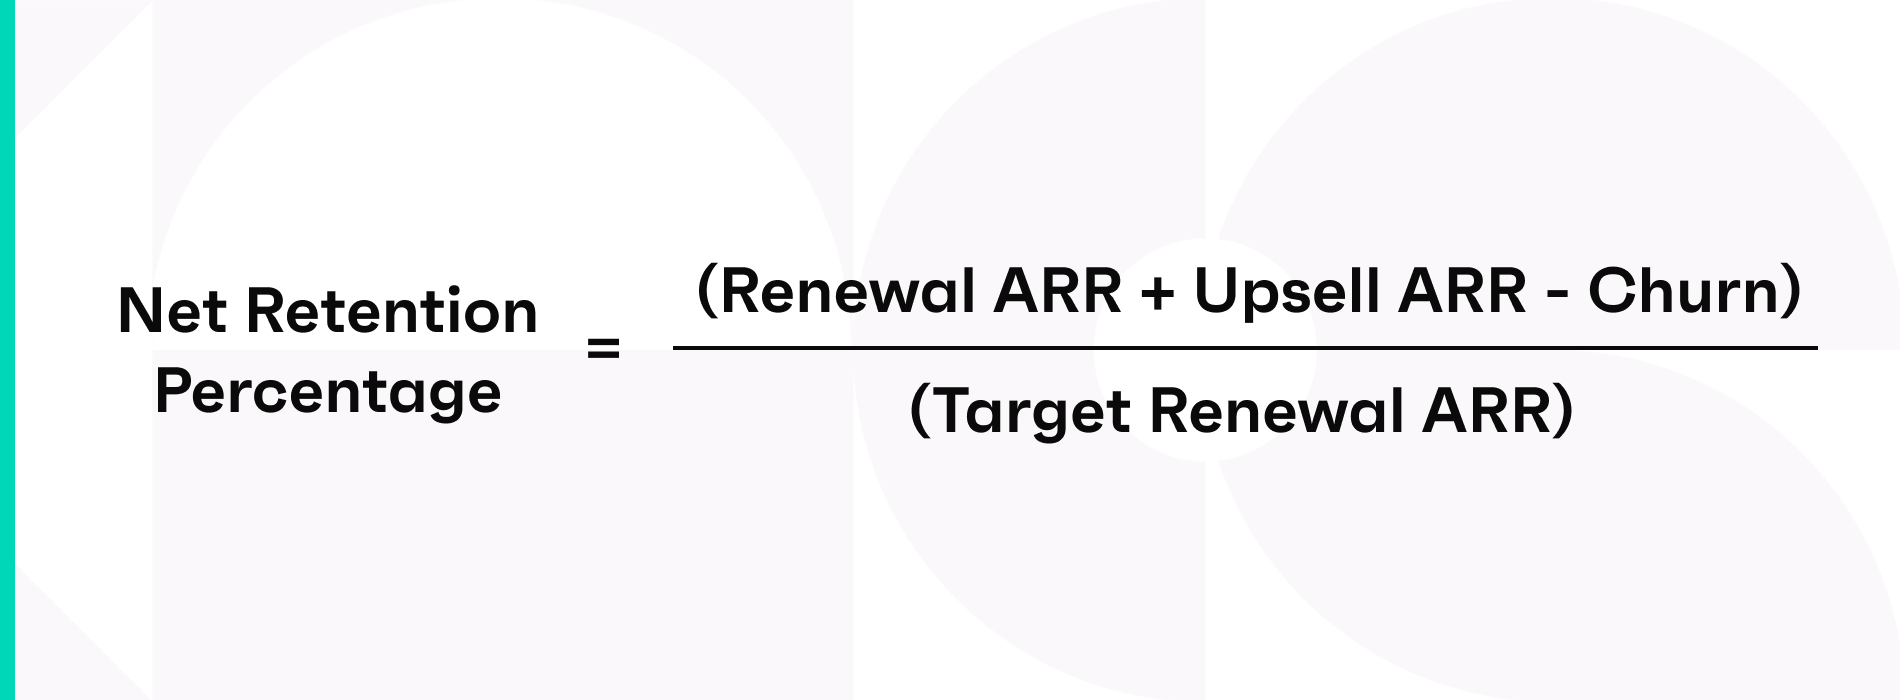
Keep in mind that this isn't a static metric, so you'll want visibility into real-time renewal, upsell, and churn forecasts to help your sales and customer success teams achieve customer satisfaction and growth.
Quantity metrics
Sales quantity metrics measure the size of your sales activities, whether the number of deals you have or the size of each deal.
Average deal size/Average selling price
The average deal size or average selling price refers to the average dollar amount of each closed deal.
The ASP calculation:
Average selling price = (total $ of closed deals over a specific time period) / (total # of deals)
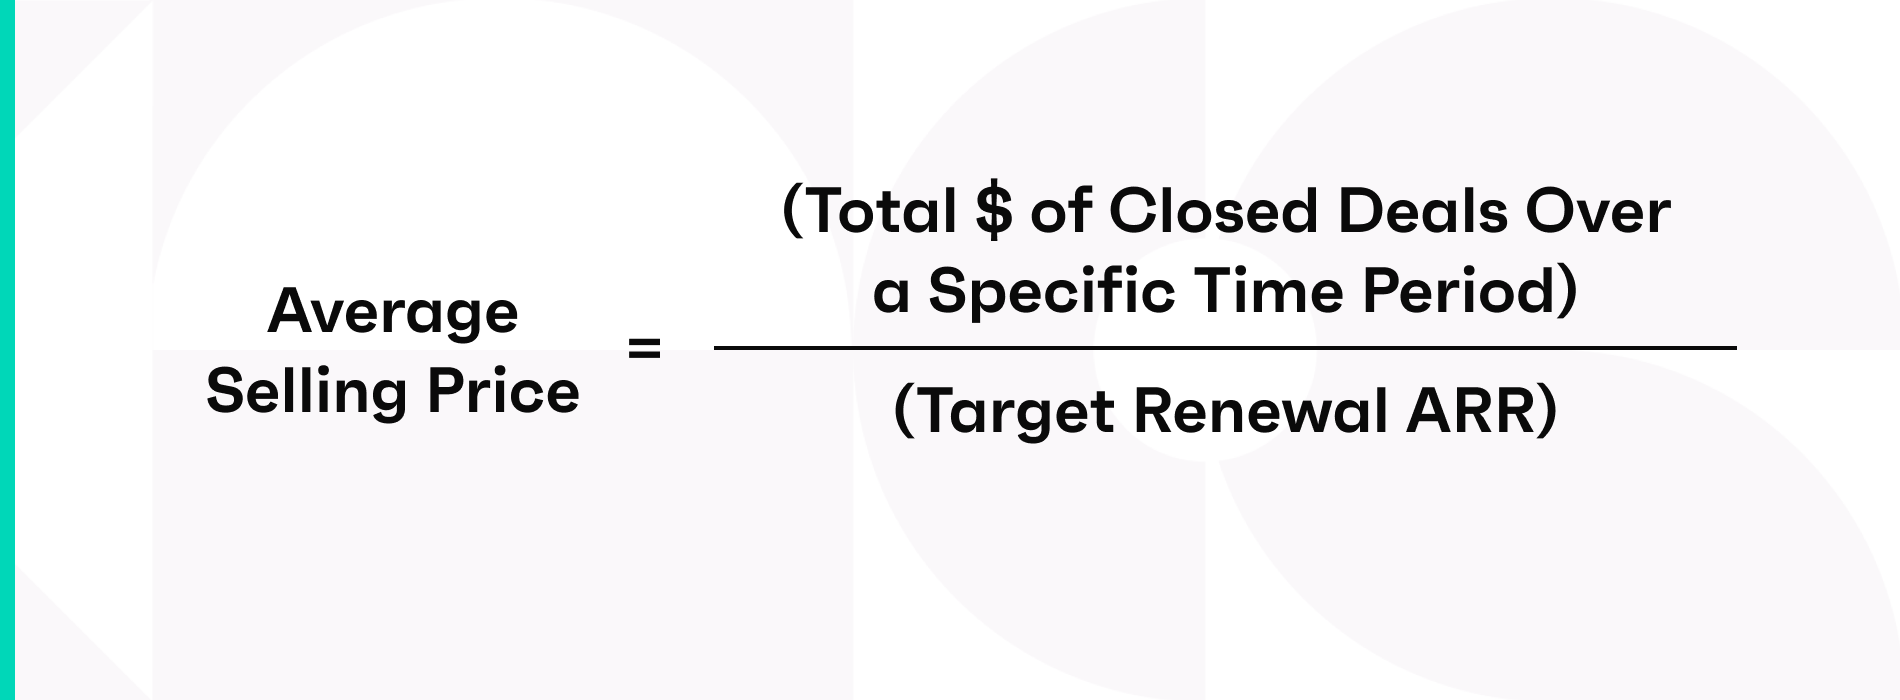
If a company closes three deals in a quarter at $60,000, $60,000, and $75,000, the average selling price for that quarter would be $65,000 for that quarter.
This metric is indicative of your revenue team's ability to go upmarket and land larger deals. Is your message resonating with customers with bigger pockets? Are your sales teams able to manage complex sales cycles with larger price tags attached?
Average deal size should be tracked by total business for the given time period (monthly, quarterly, annually), as well as broken down by renewals and new deals to get an understanding of where the most profitable deals lie.
Pipeline coverage
Pipeline coverage refers to the amount of opportunities you have in your sales pipeline to ensure you reach your sales target. Many organizations follow the 3 times rule, but how you calculate this ratio will depend on many factors, including your business segment, your product, the length of your sales cycles, and more.
In today's uncertain economic climate, sales leaders would do well to monitor their late-stage sales pipeline coverage as well. This refers to the opportunities still in play near the middle and end of the quarter.
The pipeline coverage calculation:
Late-stage pipeline coverage = (Stage 2 deals + Pipeline $) / (Forecast $ - Closed $)
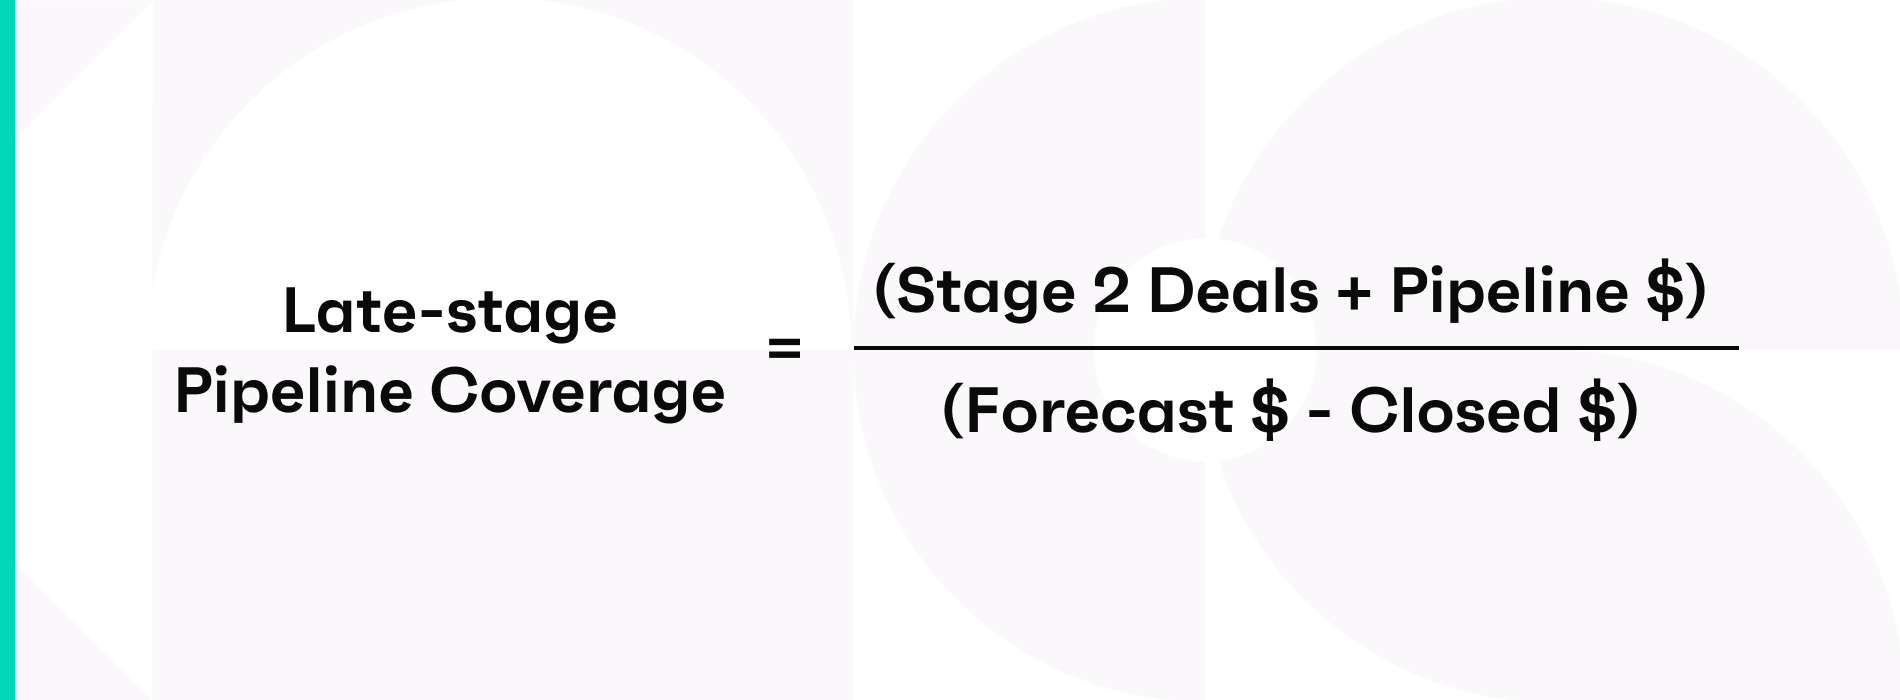
Knowing this number can help sales management course-correct fast to ensure an accurate sales forecast and successful quarter.
In our COVID Revenue Impact Study, we found that organizations slipped 8% more late stage pipeline deals (stage 2 and above) compared to the same quarter last year.
Number of deals closed
Number of deals closed is the total number of successful sales in a given period. It’s also known as the number of deals won.
This simple quantitative metric helps you see whether you’ve hit your sales targets. It’s also a good barometer of cash flow since closed deals translate directly into revenue.
Get the most from this metric by comparing it to your sales goals over the same period and the number of deals you’ve lost.
Sales activity data
Sales activity data includes any activity that any member of the revenue team engages in with a customer or prospect. It can include emails, meetings, calls, and marketing campaigns, for example. When this data is easily accessible and highly visible, sales teams can see whether a prospect is truly engaged and determine the health of the deal more accurately.
Tracking sales activity data not only shows you prospect engagement, but is also a way to gauge your sales performance metrics.
However, reliable sales activity data is notoriously hard to find because it requires manual data entry from your sales reps. Often, that data is inaccurate, out of date, or missing. And who can blame them—reps want to spend time selling, not entering data. New sales technologies are emerging that automatically track sales activity data so that it's always real-time, accurate, and available from anywhere.
How to choose the right sales metrics for your team
Because sales performance metrics illustrate what success looks like for your organization, it's critical to choose the sales metrics that matter most to your business, measure them consistently, and make them visible and accessible to the entire team with a shared source of truth, such as a revenue operations platform.
You'll also need to create a sales performance metrics lexicon to ensure that everyone is working from the same playbook and speaks the same language. Otherwise, you risk confusion and lost growth opportunities through scattered, unclear, and outdated data.
‘One of the biggest problems I see is when different teams bring their own reports with their own data each from a different source,’ says Karan Singh, Vice President of Revenue Operations at Procore Technologies and member of the Clari Revenue Operations Council. ‘What happens is that they end up spending the entire meeting debating whether the data is accurate, where it came from, or how it was pulled instead of actually strategizing on next steps.’
There are three key steps for choosing the right sales performance metrics and using KPI terminology for your organization.
1. Define your sales goals with a cross-functional team
First, sit down with each group of stakeholders in your cross-functional revenue operations team—including sales, marketing, and customer success—and map out what your shared sales goals are. Create a list of what you all think the most important sales performance metrics will be for your team, factoring in your company's overarching strategic goals and clearly defining each KPI. Agree on the calculations you'll use for each metric and designate the systems from which information should be sourced (such as your revenue operations platform or CRM).
Questions to ask your team include:
- What is our shared goal?
- Why is this outcome important for our business?
- How can we gauge progress toward this outcome?
- What can we do to influence a positive result?
- Ensuring everyone stays aligned and uses the same terminology is critical.
"We just went through an eight-month KPI standardization process," says Procore's Singh. "We asked ourselves, 'What is the annual contract value? How do we define a customer? What do our KPIs actually mean down to the field level?' Aligning on these definitions is critical to ensuring that the entire revenue team is on the same page every step of the way."
2. Use specific, actionable, and measurable metrics
The metrics you designate as your KPIs should be directly linked to your overall business goals, and you should also be able to directly impact those goals by providing strategic insights. That means sales performance metrics should be specific, actionable, and measurable.
One way to ensure that you choose actionable sales performance metrics is by following the SMART principles. SMART stands for specific, measurable, attainable, relevant, time-bound:
- Define a specific outcome.
- Make sure you can measure progress toward this outcome.
- Ensure the outcome is attainable.
- Confirm your goal is relevant to your organization and its growth.
- Establish the timeframe needed to achieve this outcome.
- Record your KPIs in a clear, easily accessible resource for the entire revenue team to use.
Consider using a chart or worksheet that contains your agreed-upon KPI terminology, definitions, calculations, and relevant data sources. Many companies choose to centralize this information in a shared source of truth, like a RevOps platform.
3. Review and update your sales performance metrics over time
Make sure to pressure-test your new KPI resource with your go-to-market teams. Review and update sales performance metrics over time as your goals evolve and consider designating a teammate to own those updates so that they remain clear and consistent. You can also add this document to onboarding materials for your go-to-market teams to establish alignment upfront.
Download the sales metrics worksheet
Download our Sales KPI Worksheet to help you select, define, measure, and leverage the best KPIs and metrics for your organization. This chart is based on real-world insights from members of the Revenue Operations Council and their years of experience growing revenue at world-class companies.
Download the KPI lexicon and calculations worksheet.
How to easily track sales performance metrics
The secret to successfully tracking sales performance metrics is having a platform that captures everything.
Enter Clari.
The Clari Revenue Platform gives you a complete view of your pipeline, capturing every metric so you know where every deal stands and how each rep performs. Real-time dashboards keep you in the loop, while Clari Copilot automatically flags issues and highlights areas for improvement.
Ready to see how Clari can help you track sales performance metrics? Schedule a demo today.