

Data science is all around us—you just have to look. Sports is a beautiful example. As competition heats up, teams look for an edge. The smart ones turn to data science.
Teams are starting to systematically track and record every aspect of the game. This results in a huge amount of data ripe for analysis. Teams can unearth valuable insights to drive improved performance on the field as well as well-managed post-performance recovery.
Data science is already making a dramatic impact in sports. Let's take a look at some of the use cases. At minimum, you'll get new insight into some of your favorite games. And at best, you may be inspired to up your own game with a healthy serving of data science.
Recruiting
Data science in sports recruiting reached prominence in the movie Moneyball and the approach to analysis known as "sabermetrics" in Major League Baseball. The point of sabermetrics is to identify data that more correctly aligns with the goal of a batting team scoring runs or the fielding team restricting opponents. Features that are significant contributors are identified, named, and measured for each player as they progress through their high school, college, and minor league games. Rather than use batting average, data science encourages measuring player effectiveness with more sophisticated measures like equivalent average and total player rating. In doing so, data science takes into account factors that may not be captured in a simple average.
As an example, plain old batting average is not comparable unless the quality of the league (major league, minor league, Triple-A, Double-A etc.), the quality of opposing team's pitching and fielding strength, the size of the ballparks, etc. are all considered. The data science approach accounts for 50 to 100 different factors to derive a metric to more effectively reflect a player's potential. As Moneyball illustrated so colorfully, evaluation in the past was often based purely on gut. Today, many teams use large-scale analysis of player performance, including external factors that influence performance.
Team-level analytics include correlating the number of runs scored and runs allowed to predict the number of wins and losses. The famous sabermetric, Pythagorean expectation, is an attempt to curve-fit across a two-dimensional plane of data.
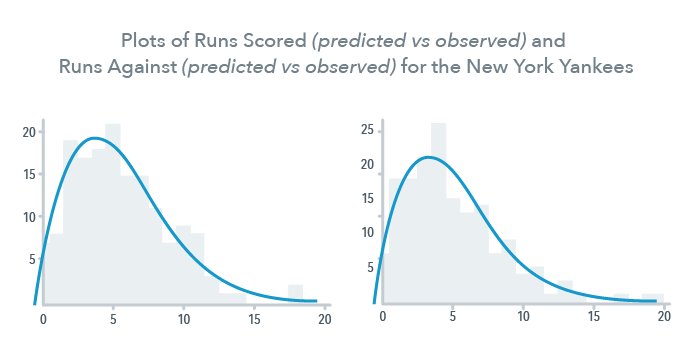
The probability of winning is defined as:
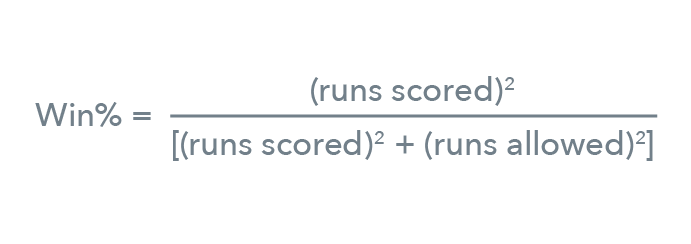
It may not surprise you that data science is able to predict, with a high degree of accuracy, a win-loss record from the difference between runs scored and runs allowed. After all, a naive first pass at this would be to assume that the more runs you score, the more games you will win. However, this doesn't take into account close games. In even a single seven-game series, it's easy to see cases where the team winning the series (by winning four of seven games) actually had fewer total runs—typically because that winning team was blown out in one or two games on their way to eventual series victory. Over the course of a season, this effect can cripple a naive model. Data science can take us to a whole new level of accuracy. First, data science can predict how many close games are likely in a long season of play. Then data science can specifically look at a team's tendency to win close games. As you can imagine, a team's tendency to win close games may rest on additional data strategic game-day decisions rather than simply the runs scored.
Player analysis for basketball performance has also reached new levels with Muthu Alagappan analytics, where each player's performance is defined, tracked, and categorized at fine granular levels. He refined the standard five positions of basketball into a more realistic 13 positions. Using these position descriptions, each NBA team is evaluated for its effectiveness, its market value as a whole, and possible outcomes when facing each other.
Training
Another area where data science is challenging conventional wisdom is in training to support both injury prevention and game-time performance. Pioneering this, P3 Applied Sports Science tracks injury data and ways to reduce certain injuries. A 10-year study of hamstring injuries by Marcus Elliott, et. al. identifies times in the season when such injuries occur, how to reduce occurrence, etc. Another aspect is game-time performance tracking using technology from Catapult. The system monitors 1,000 unique data points per second per athlete, such as speed, heart rate, breathing rate, etc.
Chip Kelly, currently the coach of Philadelphia Eagles, pioneered Catapult's use among University of Oregon athletes. When real-time human physiology data is tracked over many years, the data patterns that emerge can fairly accurately categorize athletes into various fitness levels, propensity for injury, etc. Moreover, game-time decisions, such as whether to run a no-huddle offense with little time between snaps, are feasible given the fitness level and playing time of the current on-field athletes.
The data science-driven training methods used by the NFL have now penetrated soccer—the Seattle Sounders of Major League Soccer use the Catapult training monitoring system to understand game-time workloads of each position as well as injury prevention strategies.
Game Strategy
Using data science tactically during a game has long been practiced in baseball, affecting decisions such as pitch selection, player substitution, defensive field placements, and offensive maneuvers such as steal attempts. An example of this is simulating thousands of games using various baseball lineups for identifying the most optimal one—the study Optimizing Youth Baseball Batting Orders by Stephen J. Robinson highlights this use case.
Of course, these data science uses have been refined over the years to the point that game strategy, player recruiting, and training have all been combined into a full package. After all, if data science can be used to decide your tactical moves, you will need to match those moves with players who can execute them. This means the right players must be recruited and the right training methods applied to reach the highest level of success.
Betting
For those of us who are not elite athletes or coaches, I've saved the best for last: betting. With enough data on players, game performance, and game strategies, wouldn't you be able to build a probabilistic model to make better bets? This is the concept behind Swish Analytics, a company that crunches all the data it can find to offer accurate sports predictions. For this use case, mobile access to the prediction data is critical—many fans are on the road and would love to get insights to improve their betting odds instantly.
As you watch, with great pain and helplessness, your March Madness college basketball brackets get decimated, perhaps relying on data science rather than your gut would help you be a bracket hero at the office.
We at Clari specialize in data science for business use cases, such as predictive sales analytics, to deliver high-value insights to sales reps, managers, and key executives. The same principles that help you win in sports apply to winning in sales. If you aren't using data science in your sales teams, what are you waiting for?