

Accurate revenue projections give organizations confidence to make smart strategic decisions regarding their business plan—for example, where they should invest resources, which deals should be prioritized, and what gaps need to be addressed.
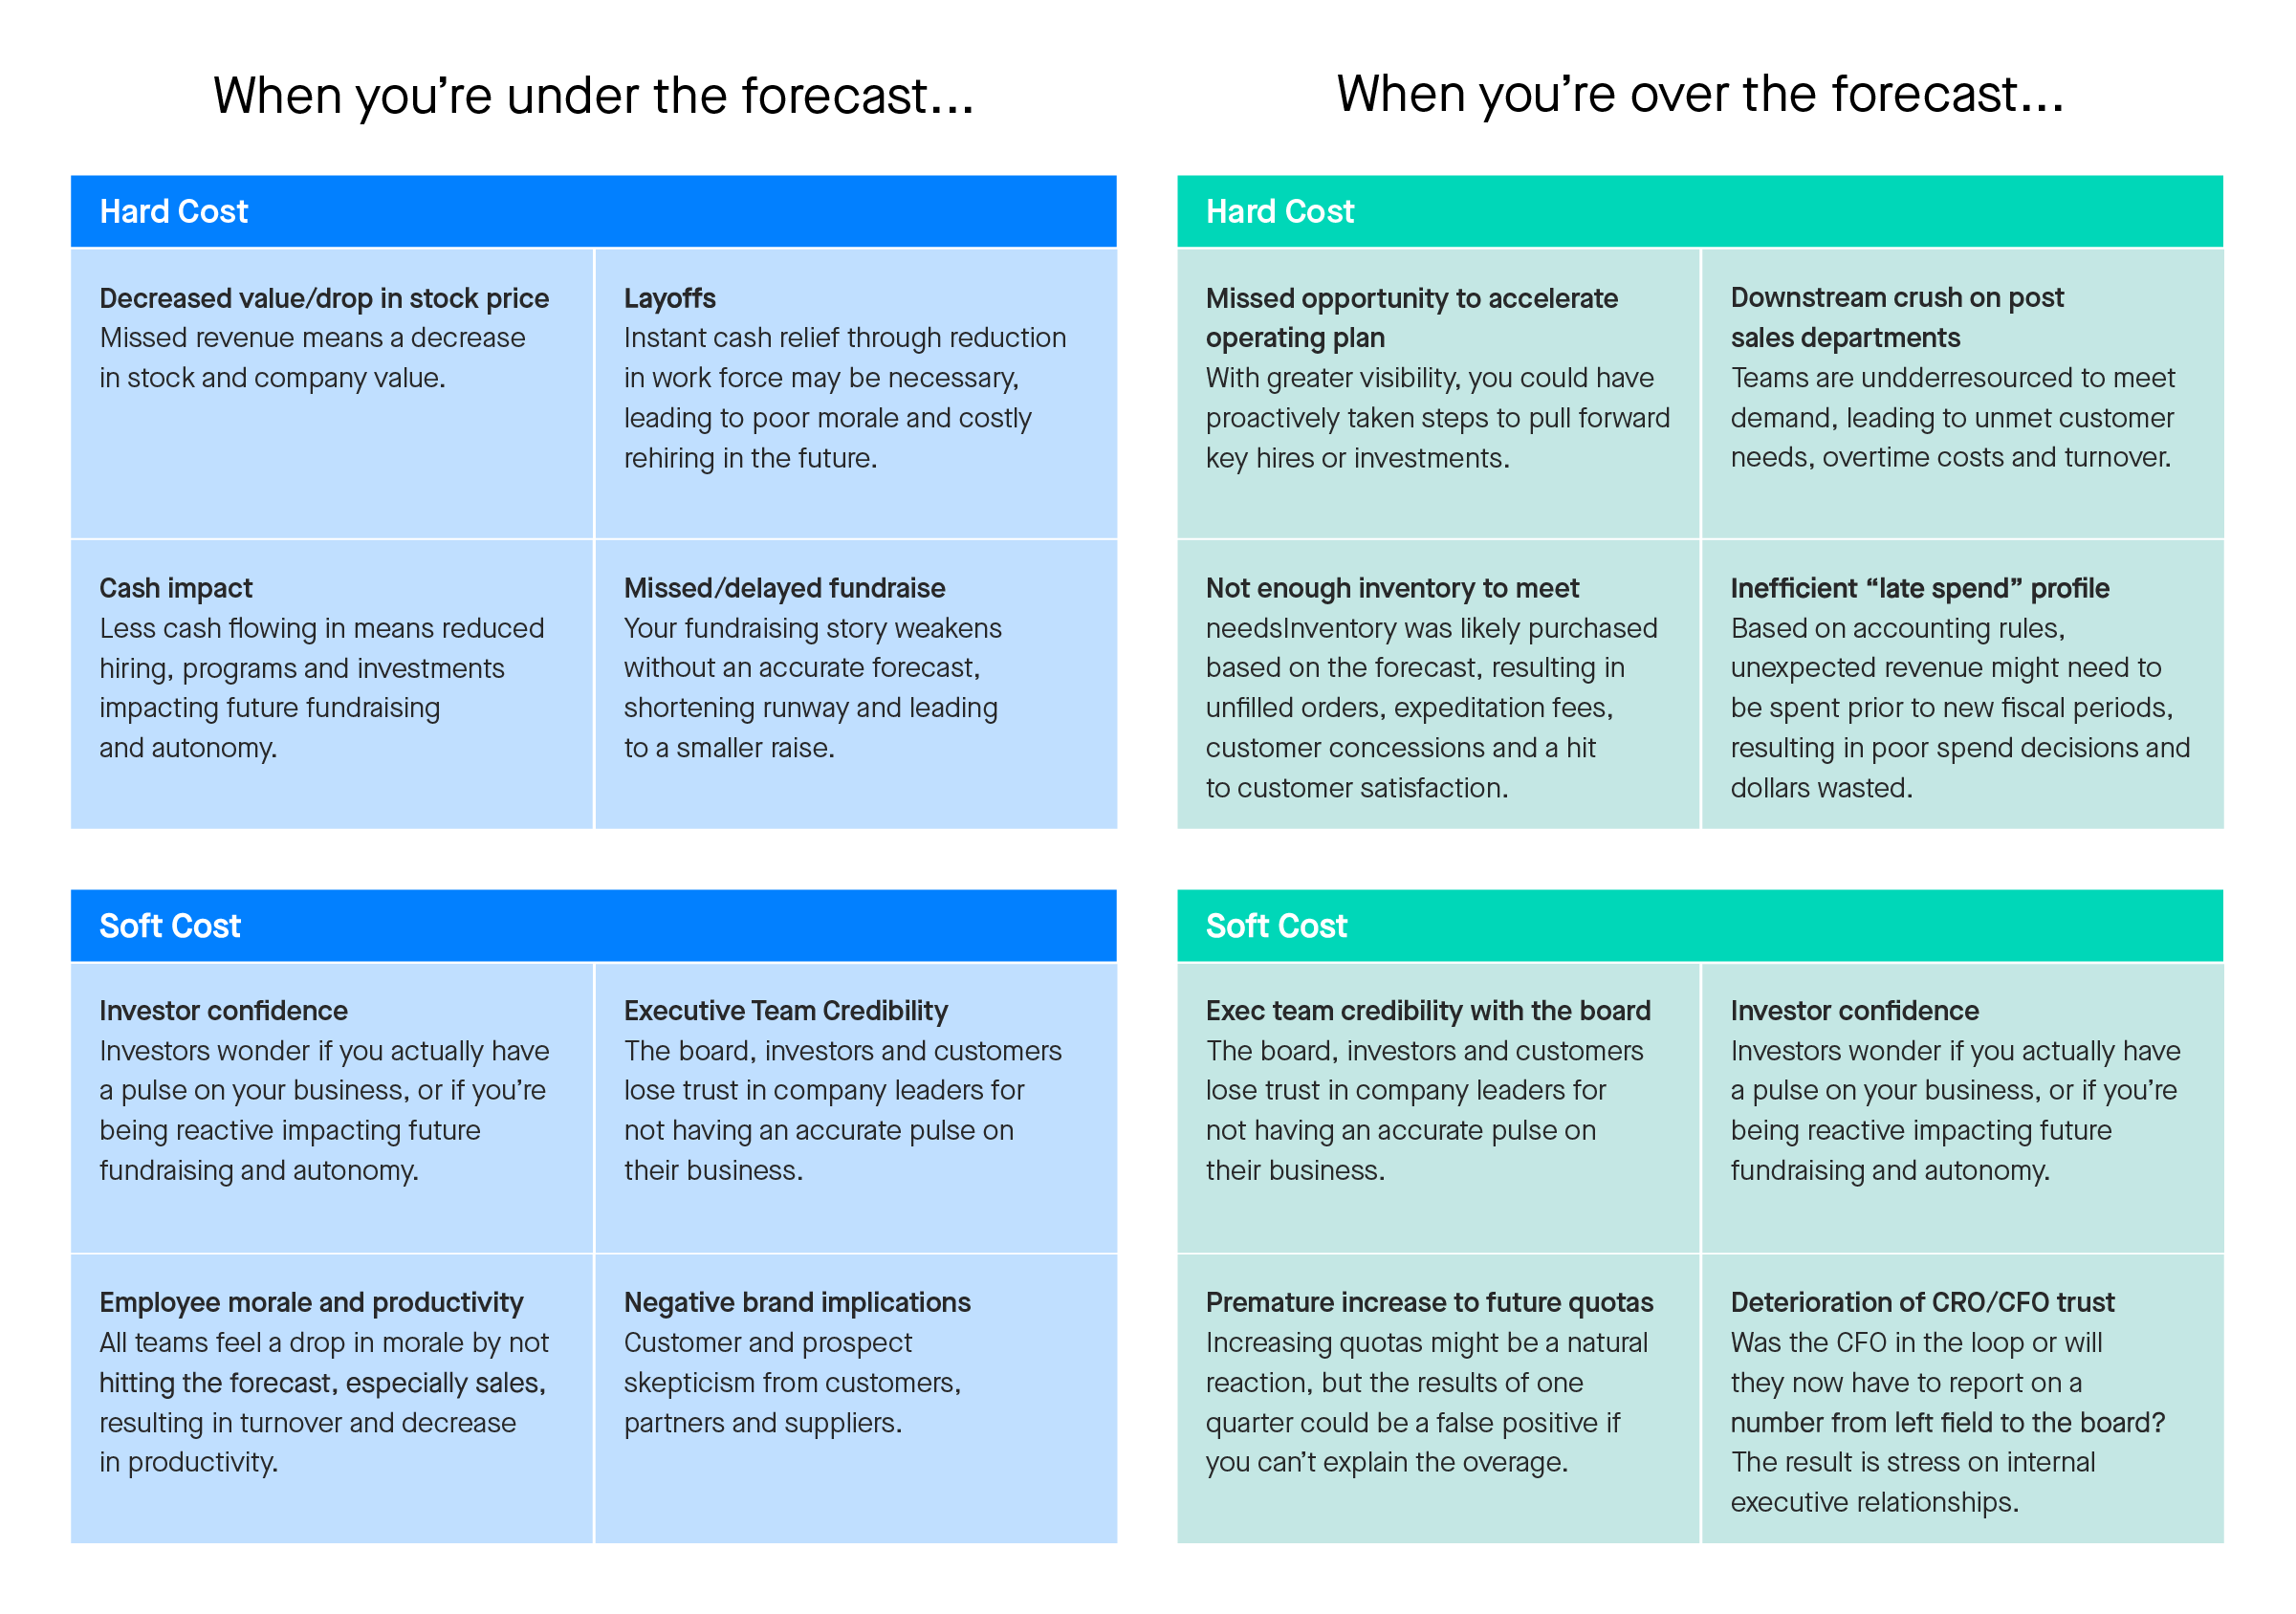
Issuing guidance, and determining what revenue projections to share, is a collaboration among executive leadership and investors. But missed guidance is on the rise, and companies are having trouble beating the numbers. This is a disservice to shareholders, employees, and the organization as a whole.
Missed or inaccurate sales forecasts can impede business growth, seed internal mistrust, and hamper efforts to attract and retain investors. Unfortunately, the challenge is a common one. Gartner reports that 55% of sales leaders don’t have a high degree of confidence in their sales forecast accuracy.
Today, there’s software and artificial intelligence to help you forecast revenue accurately. In some ways, newer businesses may be at an advantage—they can adopt these measures for calculating revenue and financial projections correctly from day one instead of forcing revenue operations teams to adjust to a new system.
However, even legacy firms with decades of experience can benefit from shifting to more modern ways to calculate revenue projections. As a result, sales leaders gain greater efficiencies, insights, transparency, and data they can be confident is the most robust and accurate for making revenue projections.
What are Revenue Projections?
Revenue projections represent the money an organization estimates will be earned within a specified time period. For sales organizations, revenue projections refer to the sales revenue generated from the product or service they sell. Projecting revenue is important because it helps organizations avoid risks that can shutter any business—the result of missed guidance referenced above.
Revenue is money earned after the total scope of the service is performed—gross revenue, or the number atop a balance sheet. Revenue projects predict how much revenue will be generated over the fiscal year or a specific period of time in the future.
For established businesses, executives might consider their revenue for the past year or quarter, as well as pipeline generated, market forces, and any sales staff growth or shrinkage. Newer businesses have less data to work with from previous timeframes, making reliable revenue projects more challenging.
Ultimately, the goal of any organization is to end the quarter or year within a tight margin of error of the revenue projection established at the start of the quarter.
Different aspects of a business play into revenue projections in different ways:
- For a B2B software-as-a-service (SaaS) business, annual recurring revenue from multi-year customer subscriptions provide a key baseline for revenue projections.
- Quarterly and annual projections are based on market data, internal sales trends, and similar key performance indicators.
- Artificial intelligence can help power more immediate revenue projections in real time.
Calculating Your Revenue Projection
The first revenue projection plan starts at the top of the year and includes a revenue goal based on renewals or net dollar retention. Your final revenue projection should encompass all earned revenue for a given period, but to drill down, there are a few ways to calculate revenue:
Annual Recurring Revenue (ARR)
Annual recurring revenue, or ARR, is the total amount of contracted revenue that your company brings in each year. It’s a particularly crucial key performance indicator (KPI) to follow for any subscription-based SaaS business, as it tells you how much money you can expect to receive from customers in a given fiscal year. When tracked historically, ARR can be used to evaluate a company’s growth and assist in long-term forecasting.
The ARR calculation:
Annual recurring revenue (ARR) = (total value of a contract) / (number of contract years)
Average Revenue Per User (ARPU)
Average revenue per user (ARPU) or average revenue per account (ARPA) refers to the amount of money that a company brings in per subscriber, user, or account in a particular time period. It is calculated by dividing the total amount of revenue for that time period by the number of subscribers, customers, or accounts during that period:
The ARPU/ARPA calculation:
ARPU/ARPA = (total amount of revenue in given time period) / (average number of subscribers during that time period)
Net Dollar Retention Percentage (NDR)
Given continued market uncertainty these days, more and more businesses want to keep their current customer bases in an effort to maintain a level of stability. Net retention percentage goes hand in hand with churn rate, but with a slight twist.
The net retention percentage calculation:
Net retention percentage = (Renewal ARR + Upsell ARR - Churn) / (Target Renewal ARR)
Traditional Methods of Predicting Revenue
Forecasts in real time, predicted by platforms that use artificial intelligence, offer users immediate knowledge about what gaps need closing, among other factors, to help reach their revenue goal.
Creating a revenue forecast was cumbersome and convoluted before machine learning created the opportunity to automate the process. Salespeople had to work across multiple products, none of them integrated. To get a semblance of transparency, they had to engage with data and forecasting tools, like spreadsheets, that were difficult and time-consuming to organize, keep up, and report out.
The Challenges with Outdated Projection Models
Spreadsheets still dominate an entrepreneur’s or sales leader’s Sundays as they grasp for meaningful insights in a sea of revenue data signals.
Imagine the CEO of a startup.
The firm has secured initial funding, they have a product showing good market fit, and now, executives need to consider where to invest their cash. Do they need to drive pipeline and therefore hire marketers? Or are they looking to grow new markets, prepare for IPO, or close existing pipeline? In that case, adding new sales leaders and reps makes more sense.
The answers rely in part on projection models. But traditional methods of projecting revenue rely on outdated projection models that can’t keep pace with modern business demands.
For example, traditional manual entry processes, like those entailing spreadsheets, can help calculate revenue projections, but those projections are only as good as the metrics captured—which are often incomplete or out of date. Reps aren’t motivated to spend time keeping detailed, accurate data records. Every minute in a spreadsheet for a rep is another minute they’re not selling. And filling out all the little boxes doesn’t help their quota. That leads to spreadsheets riddled with mistakes and data that’s weeks, if not months, behind the most recent business shifts.
The CEO then makes investment decisions based on these outdated projection models. As a result, they may decide more marketing is needed to drive more pipeline without realizing that pipeline data is inaccurate. Instead, they need to focus on win rates to drive accurate projections.
How Modern Technology Can Improve Revenue Projections
Companies everywhere struggle with antiquated revenue processes, despite revenue being the most important growth driver. Some would even argue that predictable revenue processes are the last to finally be transformed and ushered into the 21st century.
Everyone in the business, from the boardroom to the front line sales rep, clamors for more real-time, historical, and predictive visibility and transparency into every aspect of the business so they can make key decisions with confidence.
Modern technology, and specifically revenue operations platforms, take the time, mistakes, and manual labor out of key business indicators like revenue projections calculations, which in turn powers more accurate forecasting and a cascade of powerful decision-making that drives revenue growth.
AI and Machine Learning
Artificial intelligence and machine learning applied to a revenue operations platform take data from past deals and projections, compare that to current revenue operations data, and predict outcomes for future weeks, quarters, and the year.
Clari, for example, can call the quarter with better than 95% accuracy by its second week, and estimations can get even closer to complete accuracy the longer a business is in the platform and has more data for the AI to learn from.
CRM Automation
CRM automation software helps salespeople and customer service professionals track and manage their entire outreach to customers.
Organizing sales activity through automation helps free data from silos. The holistic nature of an automated revenue projection process means that data sourced throughout the organization is optimized to generate insights that speak to the entire sales process, not only an individual component. Optimizing historical data also gives everyone within the organization a single source of truth.
For example, CRM automation helps salespeople share lead information and context without having to chase down contact information like emails and phone numbers or past activity. It can reduce tedious tasks of running reports or managing data manually. By using CRM automation to export data, salespeople have clear visibility into their entire sales pipeline.
For marketing, CRM helps run email drip sequences, assign leads to the right reps, and more. For customer service, CRM can operate live chatbots and automatically respond to customer inquiries, among other features.
Sales Process Improvements
A sales process delineates the steps taken for a product or service to be sold. The sales process can extend from initial outreach and pipeline to the moment contracts are signed.
There are several key points in a sales process. Handoffs, for example, represent the point in the sales process where a sales development representative (SDR) passes off to a sales rep, who eventually passes off to customer success once the deal is won. Each handoff holds a risk of introducing questions or pauses from the prospect that can tank a sale.
In terms of calculating revenue projections accurately, it’s vital to codify the steps in the sales process and define what each step means. A deal at an earlier stage will likely need more time to close than one closer to signing a contract, so the estimates of when a company will see that revenue differ.
Increasingly, companies that align on shared sources of truth to define sales processes and stages can better track revenue and make more accurate projections. For many executives, this means investing in a revenue operations platform or CRM system to drive and support these improvements.
Transform Your Revenue Process
Transforming the revenue process has become a key focus of modern revenue organizations as today’s technology improves traditional sales methods. A crucial part of the modern sales transformation includes calculating revenue projections accurately.
For some companies, automating the revenue process represents a significant cultural change because it requires excellent collaboration and trust among all parties in an organization. The benefits, however, are obvious: In a recent customer survey, more than 90% of salespeople say Clari gives them time back to sell, while 89% of managers noted better pipeline visibility, and 93% of sales leaders saw improved forecast accuracy.
Read more:
- How Fortinet Hit 97% Forecast Accuracy
- Clari’s New Features Give You the Flexibility to Support Dynamic Revenue Needs
- Sales Engineers: The Benefit of Aligning With Your Unsung Heroes